Tableau transforms raw data into interactive visualizations that drive business intelligence and informed decision-making.
Create dynamic, user-friendly dashboards that allow stakeholders to explore data and discover insights.
Connect to live data sources for instant updates and real-time business intelligence.
Transform complex data into clear, actionable visual stories that everyone can understand.

• Tableau Desktop & Server
• Tableau Prep Builder
• Tableau Public & Online
• Data Validation & Quality Checks
• User Access Management
• Performance Optimization
Dashboards Created
User Satisfaction
Faster Insights
Data Breaches
Comprehensive data visualization services that transform your data into actionable insights.
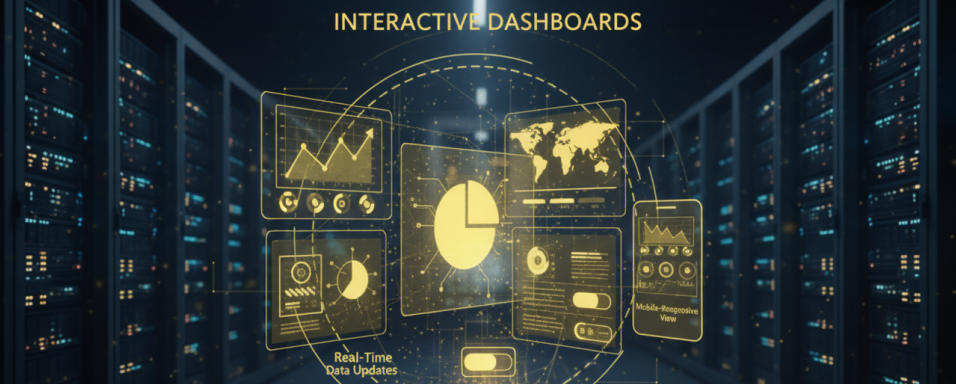
Create dynamic, user-friendly dashboards that allow stakeholders to explore data and discover insights.
Custom Dashboard Design
Interactive Filters & Controls
Real-Time Data Updates
Mobile-Responsive Views

Transform complex data into compelling visual narratives that drive decision-making.
Narrative Visualizations
Guided Analytics
Animated Insights
Contextual Explanations

Leverage Tableau's powerful analytics capabilities for deep data exploration and insights.
Predictive Analytics
Statistical Analysis
Trend Forecasting
Performance Metrics
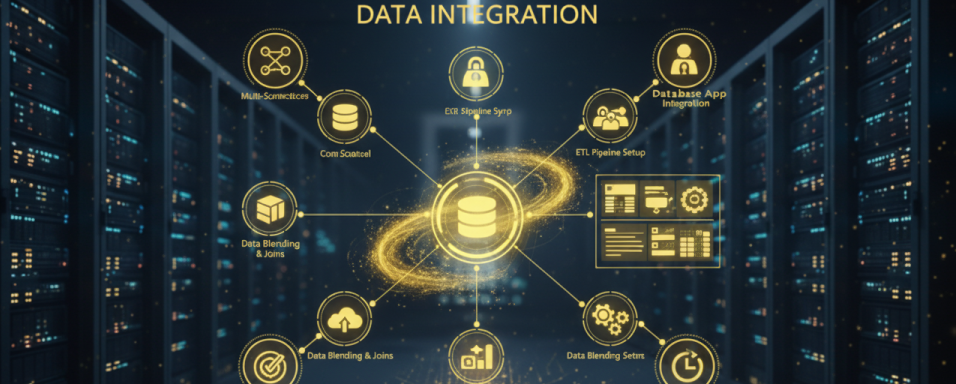
Connect and blend data from multiple sources for comprehensive analysis and reporting.
Multi-Source Connections
Data Blending & Joins
ETL Pipeline Setup
Real-Time Data Sync
A streamlined approach to transform your ideas into powerful digital solutions
Understand your data needs and visualization goals
Design dashboard architecture and data flow
Build interactive dashboards with Tableau
Validate data accuracy and user experience
Deploy and provide training and support
Transform your data into powerful insights with our expert Tableau visualization services.
Discover how our Tableau expertise transforms industries through powerful data visualizations.
Transform business data into actionable insights with interactive dashboards and real-time analytics.
KPI Dashboards
Performance Metrics
Trend Analysis
Executive Reporting
Visualize sales performance, customer behavior, and market trends for data-driven decisions.
Sales Performance Tracking
Customer Segmentation
Market Analysis
Revenue Forecasting
Monitor patient outcomes, operational efficiency, and healthcare metrics with interactive visualizations.
Patient Analytics
Operational Dashboards
Clinical Performance
Resource Optimization
Track production metrics, quality control, and supply chain performance with real-time dashboards.
Production Monitoring
Quality Control Metrics
Supply Chain Analytics
Predictive Maintenance
Real-time financial reporting and risk analysis
Customer behavior analysis and inventory optimization
Patient outcomes and operational efficiency tracking
Production monitoring and quality control analytics

Intuitive dashboards that users love, ensuring high adoption rates and engagement
Reduce time-to-insight with interactive visualizations that make data exploration intuitive
Live data connections that provide instant updates and current business intelligence
Discover how we've helped businesses transform their digital presence and achieve remarkable results.
We developed a comprehensive Tableau dashboard that increased sales insights by 65% and improved inventory management for a leading retail chain.
in sales insights within 3 months
in annual cost savings from inventory optimization


TABLEAU
Created a comprehensive Tableau dashboard for patient outcomes and operational efficiency.
4 month project

TABLEAU
Built a real-time financial reporting dashboard for risk analysis and performance tracking.
3.5 month project

TABLEAU
Developed a production monitoring dashboard for quality control and supply chain analytics.
4 month project
Let's transform your data into powerful insights with our expert Tableau visualization services.
Industry-leading expertise, proven visualization techniques, and unmatched performance in data analytics.
500+ dashboards created with 98% user satisfaction. Our design expertise ensures intuitive and impactful data stories.
60% faster insights with optimized dashboards and efficient data connections that scale with your business.
Launch faster with our proven Tableau framework. From concept to dashboard in weeks, not months.
| Why We Stand Out | ||
|---|---|---|
| Feature | 4Born Technologies | Others |
| Dashboard Design | ✓ Expert Level | Basic |
| Performance Optimization | ✓ Advanced | Standard |
| Data Integration | ✓ 50+ Sources | Limited |
| 24/7 Support | ✓ Always Available | Business Hours |
| User Training | ✓ Comprehensive | Basic |
Ready to transform your data into powerful insights? Let's start the conversation about your visualization needs and goals.

We'll discuss your data needs, goals, and how Tableau can help.
Our team will create a tailored Tableau dashboard proposal for your review.
We build your dashboards with regular updates and thorough testing.
We launch your dashboards and provide training and ongoing support.
A Tableau project typically takes 2-6 weeks depending on complexity. Simple dashboards can be completed in 2-3 weeks, while complex multi-source analytics platforms may take 4-6 weeks. Our agile approach ensures regular updates and quick iterations.
Tableau can connect to 50+ data sources including databases (SQL Server, Oracle, MySQL), cloud platforms (AWS, Azure, Google Cloud), files (Excel, CSV, JSON), and web services. We specialize in complex data blending and real-time connections.
We optimize dashboard performance through efficient data modeling, calculated fields optimization, and proper filtering strategies. Our dashboards achieve 60% faster load times and maintain responsiveness even with large datasets.
Yes, we provide comprehensive user training including dashboard navigation, data exploration techniques, and best practices. Our training ensures 98% user adoption and maximizes the value of your Tableau investment.
Absolutely! Tableau supports real-time data connections through live connections to databases, APIs, and streaming platforms. We've implemented real-time dashboards that update automatically, providing instant business intelligence.